Data & Statistics for Life Sciences Research
Biology is 50% Fieldwork and 50% Data Analysis.
Research in Life Sciences—whether Zoology, Botany, or Ecology—is not only about collecting samples. Half of your scientific rigor lies in how accurately you organise, analyse, and interpret your data.
This guide explains how to handle research data—from Excel management to advanced statistical interpretation—specifically tailored for MSc dissertations and Ph.D. thesis work.
1. Data Management: The Foundation
Before touching SPSS, R, or PAST, your data must be clean, structured, and reproducible. The most common reason for statistical errors is not the math, but the formatting of the source file.
The “Tidy Data” Format
Your master Excel sheet must follow strict rules to be readable by statistical software:
- Rows = Individual samples (e.g., Water Bottle A1).
- Columns = Variables/Parameters (e.g., pH, Temperature).
- No Merged Cells = Software cannot read merged headers.
- Raw Data Only = Do not put averages in the raw data sheet; calculate them later.
Recommended Excel Header Format
Copy this structure for your master data sheet. Note the use of underscores (_) instead of spaces in the headers.
| A | B | C | D | E | F | |
| 1 | Date | Site_ID | Season | Replicate | Temp_C | pH_Val |
| 2 | 2024-01-15 | Lake_A | Winter | R1 | 22.4 | 7.8 |
| 3 | 2024-01-15 | Lake_A | Winter | R2 | 22.6 | 7.9 |
| 4 | 2024-01-15 | Lake_A | Winter | R3 | 22.5 | 7.8 |
Correct vs. Incorrect Data Entry
| Site 1 (Morning) | Temp: 25 |
| Site 1 (Evening) | Temp: 28 |
Error: Text and data mixed. Software cannot read “Temp: 25”.
| Site | Time | Temp_C |
|---|---|---|
| S1 | Morning | 25.0 |
Correct: Variables in columns, distinct values in cells.
Always collect at least three replicates (n=3) for every sample. Without replicates, you cannot calculate Standard Deviation (SD), and you cannot run an ANOVA. A single number is an observation; three numbers are data.
2. Reporting Your Data: Mean, SD, and SE
Before testing hypotheses, you must describe your data. In your thesis/paper, never report just the raw mean.
Standard Deviation (SD) vs. Standard Error (SE)
- Use SD when describing the variation within your population (e.g., “The fish sizes varied greatly, Mean = 12 ± 4 cm”).
- Use SE when comparing means between groups in graphs (error bars). SE is always smaller than SD and makes graphs look “cleaner,” but ensure you state what you are using in the figure caption.
Format for Thesis: “Dissolved Oxygen was recorded as 5.4 ± 0.3 mg/L (Mean ± SD).”
3. Choosing the Right Statistical Test
A common Ph.D. defense question is: “Why did you choose this test?” The answer depends on your study design and the “Normality” of your data.
Before running t-tests or ANOVA, run a Shapiro-Wilk Test.
- If p > 0.05: Data is Normal ➝ Use Parametric Tests (t-test, ANOVA).
- If p < 0.05: Data is Not Normal ➝ Use Non-Parametric Tests (Mann-Whitney, Kruskal-Wallis).
A. t-Test (Comparing 2 Groups)
Use when: Comparing exactly two experimental conditions.
B. One-Way ANOVA (Comparing >2 Groups)
Use when: Comparing three or more groups (e.g., Seasons, Sites, Concentrations).
C. Correlation (Relationships)
Use when: Checking if Parameter A affects Parameter B.
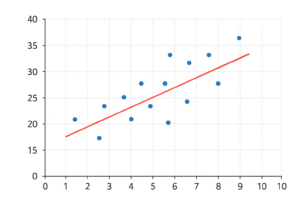
- Pearson Correlation (r): For normal data.
- Spearman Rank Correlation (ρ): For non-normal data.
Example: High Nitrates vs. Algal Bloom. If r = 0.85 and p < 0.05, there is a strong positive correlation.
4. Biodiversity Indices (For Ecology)
Converting species counts into numbers. These are standard for any biodiversity thesis.
| Index | What it tells you | Typical Values |
|---|---|---|
| Shannon-Wiener (H’) | General diversity & richness. | >3 (Healthy) <1 (Polluted) |
| Simpson (D) | Dominance (Is one species taking over?) | 0 (High diversity) 1 (Monoculture) |
| Pielou’s Evenness (J’) | Are species numbers balanced? | Closer to 1 is better. |
5. Presenting Data: Which Graph?
Don’t just use default Excel charts. Choose the graph that fits the data type.
- Bar Chart: For comparing categorical groups (e.g., Mean hardness in Site A vs Site B). Always add Error Bars (SE).
- Box-and-Whisker Plot: The gold standard for Ph.D. papers. It shows median, range, and outliers. Use this if you have large datasets (n > 10).
- Scatter Plot: Strictly for Correlation (X vs Y).
- PCA Plot: For multivariate analysis (community structure).
6. Recommended Software
Move beyond Excel for serious analysis.
- PAST (Paleontological Statistics): Free, lightweight, and very popular in Zoology/Ecology. Highly recommended for beginners.
- SPSS: User-friendly (Click-and-go), widely accepted in Indian universities.
- R / RStudio: The global standard. Steep learning curve, but essential for high-impact journals.
- Reporting “p = 0.000” (Write p < 0.001 instead).
- Running ANOVA on data that isn’t Normal.
- Using a Line Chart for independent variables (e.g., comparing 3 different lakes).
- Not mentioning the statistical software and version in the “Materials & Methods”.
A Final Note on Integrity
P-hacking (manipulating data to get a significant p-value) is unethical. Negative results (finding no difference) are valid scientific results. Always report exactly what your data says.