
If the word “statistics” makes you want to close your laptop and go for a walk, you’re not alone. Most life-sciences students feel exactly the same way, and most guides don’t help much because they’re written for people who already understand statistics. This one isn’t. PAST is a free program that lets you run real statistical tests without writing a single line of code, and this guide walks you through it in plain language with one worked example.
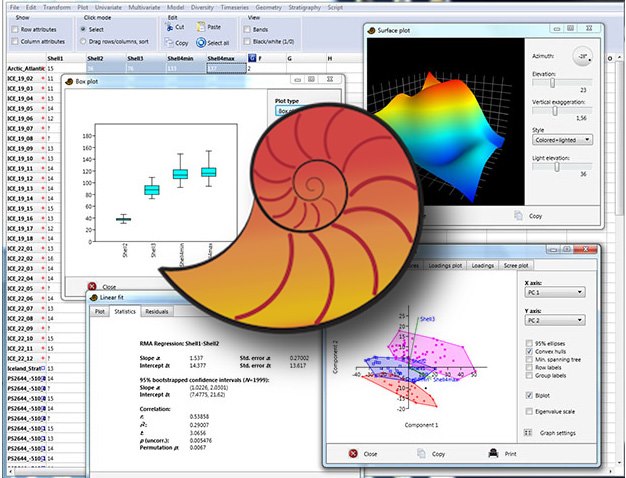
What Exactly Is PAST?
PAST stands for PAleontological STatistics. It was built by researchers at the Natural History Museum, University of Oslo, originally for palaeontologists, but ecologists, zoologists, and life-sciences students everywhere use it now. It’s free, it runs on both Windows and Mac, and it looks and feels like a simple spreadsheet. You don’t need to know Python, R, or any programming language, if you can use Excel, you can use PAST.
Getting PAST Onto Your Computer
PAST is completely free, with no license to buy and no trial period that runs out. Download it directly from the official PAST page at the University of Oslo, install it like any other program, and you’re ready to go.
📥 Official download page: nhm.uio.no/english/research/resources/past/downloads — this is the only source we recommend, since it’s maintained directly by PAST’s creators at the University of Oslo. Avoid downloading it from random third-party sites.
How the Screen Is Laid Out
When you open PAST, you’ll see a grid of rows and columns, just like a spreadsheet. Each column is usually one variable (say, shell length, or a species count), and each row is one sample or individual. You can type data in directly or copy and paste it straight from Excel. Once your data is in, you select the columns you want to test and pick an option from the Statistics menu at the top. That’s really the whole workflow: paste data, select columns, pick a test, read the result.
A Simple Example: Comparing Two Groups
Say you want to know whether snails from a polluted pond are smaller than snails from a clean pond, and you’ve measured shell length for a few snails from each site.
Here’s what that might look like with just a handful of snails, to keep the numbers simple:
| Snail # | Pond A (mm) | Pond B (mm) |
|---|---|---|
| 1 | 14 | 9 |
| 2 | 13 | 10 |
| 3 | 15 | 8 |
| 4 | 12 | 11 |
| 5 | 14 | 9 |
| Average | 13.6 | 9.4 |
Even from just five snails per pond, Pond A is clearly running bigger. In a real thesis you’d want closer to 15–20 snails per group before drawing conclusions, but the steps in PAST are exactly the same either way:
- Open PAST and paste your two sets of measurements into two separate columns. Give the columns clear names like “Pond A” and “Pond B”.
- Select both columns by clicking and dragging across them.
- Go to Statistics, then Univariate, then choose “Two-sample tests”. PAST runs several tests at once, including a t-test.
- Look at the p-value in the results window. If it’s below 0.05, the difference between your two groups is generally considered statistically significant, meaning it’s unlikely to be due to chance alone.
That’s it. No formulas to memorise, no manual calculation. PAST does the arithmetic instantly; your job is to understand what the result means and explain it clearly in your thesis.
What Else Can PAST Do?
Once you’re comfortable with a simple test like the one above, PAST opens up a lot more:
- Diversity indices — Shannon-Wiener, Simpson’s, and others are built in. If you haven’t already, see our Shannon-Wiener Index guide first.
- Correlation and regression — to see whether two variables move together, like temperature and species count.
- ANOVA — for comparing more than two groups at once.
- Cluster analysis and PCA — for spotting patterns across many variables at once, common in ecological and morphometric studies.
A Few Tips Before You Start
- Keep column headers short and clear, you’ll thank yourself later when you come back to the file.
- Always know which test you’re running and why. PAST will happily run a test on the wrong kind of data if you let it.
- Note down the exact test name and settings you used; your methodology chapter will need this.
- If a result looks surprising, double-check your data entry before you trust the statistics.
Citing PAST in Your Thesis
If you use PAST for your research, most universities expect you to cite the software itself, the same way you’d cite a book or a journal article. The standard citation is:
Hammer, Ø., Harper, D.A.T. and Ryan, P.D. (2001). PAST: Paleontological Statistics Software Package for Education and Data Analysis. Palaeontologia Electronica, 4(1), 1–9.
Check your own university’s citation style guide for exact formatting, but this reference covers everything you’ll need.
Statistics software can feel intimidating the first time you open it, but PAST was built to be approachable, and once you’ve run one test, the rest starts to make sense. For more on interpreting your results, see our Data & Statistics guide, and if you’re still deciding which biodiversity index to report, start with our Shannon-Wiener Index guide.
References
- PAST official homepage — Natural History Museum, University of Oslo
- PAST official download page — Natural History Museum, University of Oslo
- Hammer, Harper & Ryan (2001), “PAST: Paleontological Statistics Software Package for Education and Data Analysis,” Palaeontologia Electronica
- Software screenshot used above is sourced directly from the official PAST homepage (nhm.uio.no) and credited accordingly.